project WORLDVIEW copyright 2025 Home back to Choices We Make
Past Daily Courier Columns and Other Remarks about Climate Change
note: many other columns that touch on climate issues can be found here:
selected past "Science Works" Daily Courier Columns
note: you can reach Science Works columnist Stephen Cook via email: feedback@projectworldview.org
****************************************************************************
July 7, 2024
Science Works… from Prescott AZ Daily Courier July 7, 2024
Prescott
Planning for Climate Uncertainty
By Stephen P. Cook
Prescott is updating its General Plan: after City Council approval, the new edition will go before voters next year. Yavapai County went through a similar process two years ago resulting in its Yavapai County 2032 Plan. Such plans have been called “vision documents” and I—perhaps naively—connect them to a favorite Biblical passage: “Without vision, the people perish.”
As I—and one of the Prescott General Plan Review
Committee members—noted during a May 29 meeting of that group—last July in
Phoenix hundreds of people perished from extreme heat. That month, according
to National Oceanic and Atmospheric Administration records, Phoenix monthly
average temperature was 102.7 degrees (with average high of 114.7 degrees and
average low of 90.8 degrees.) This broke the previous record of 99.1 degrees by
nearly four degrees! I told the
Committee this was a strong signal that we are in uncharted territory as far as
future climate impacts our area might experience.
A few days later UN Secretary General António Guterres—backed
by the world’s preeminent climate scientists and the latest data from
Earth-observation satellites—gave a “Moment of Truth” speech. It began:
“[Today] the European Commission’s Copernicus Climate Change Service
officially reports May 2024 as the hottest May in recorded history. This marks
twelve straight months of the hottest months ever. For the past year, every turn
of the calendar has turned up the heat. Our planet is trying to tell us
something. But we don't seem to be
listening.”
I hope Prescott and Yavapai County planners listen to climate change associated concerns and study related constructive suggestions. Thinking globally, we need to phase out greenhouse gas pollution from fossil fuel and promote use of renewable solar energy. Acting locally, we must follow Arizona law. There’s no conflict here: section 9-461.05 says general plans must have an energy element that includes: “An assessment that identifies policies and practices that provide for greater uses of renewable energy sources.” I believe a proposed Yavapai County “Solar Facilities Zoning Ordinance Amendment” is inconsistent with the 2032 Plan and this law.
This
amendment limits land in the county devoted to utility scale solar to no more
than 8000 acres, over half of which has already been committed. Its regulatory
zeal is quite a departure from the 2032 Plan— which trumpeted removing
“regulatory impediments for solar developments,” and boasted “since 2018
no building permits have been required for the installation of solar panels.”
Why
the about face? Perhaps the changing political climate?
Speaking of changes, the cost of solar has plunged, its use has
sky-rocketed, and its future is bright. In its June 22 special issue, The
Economist projects solar to be “the largest source of electric power on
the planet by the mid 2030s” and “less than half as expensive” as the
cheapest electricity available today. By restricting solar development, this
amendment dictates Yavapai County won’t be part of this economic boom—one
that would bring more tax revenue, more jobs, and decreased pollution.
Its “not in my backyard” stance will cost consumers money.
Two
years ago, the Arizona Capital Times reported: “New solar generated
electricity paired with storage is selling electricity for between $15 and $25
per megawatt hour (MWh), while electricity generated from natural gas plants has
been selling anywhere between $45 and $73 per MWh.” Arizona has abundant
sunshine, but its utility ratepayers are not benefitting. Thus I have urged
Prescott Plan writers to include this goal: “The
City of Prescott needs to both help promote and be ready to take advantage of
steps the Arizona Legislature takes to study first, then enable Community Choice
Energy options.” I agree with Diana Furchtgott-Roth who leads the Energy and
Climate Program at the Heritage Foundation, a conservative think tank. She says,
"Allow people to choose the least expensive electricity options that meet
their needs." I add, “If
environmental costs are factored in, we can’t afford fossil fuel.”
Replacing
the word “electricity” with “housing” in Diana’s statement,
brings me to another goal I suggested for the “Resiliency and
Sustainability” chapter of the Prescott General Plan: “Promote
the energy and cost savings associated with building / installing / utilizing
affordable tiny homes, and discourage the proliferation of expensive,
energy-wasting large single-family residences.”
Granted, tiny homes are not for everyone—but at $200 per sq. ft, the
cost of a 2400 sq. ft. house exceeds that of a 400 sq. ft. home by $400,000!
Prescott has too many large homes and not enough smaller, affordable housing. Median prices of what homes in Prescott sell for is around $644,000, 39% higher than in Phoenix—not surprising since its average home size of 2362 sq ft is 37% bigger than Phoenix’s. Do Prescott households —average size roughly two—need bigger homes than Phoenix households—average size roughly three? No—in fact Prescott has lots of old folks hoping to downsize. One factor driving Prescott home prices: people moving here from Phoenix to escape the heat.
This movement can be expected to grow, and we need to plan for it. A sixty-day public comment period on the draft Prescott General Plan began on July 1st; you can comment on the Yavapai County amendment at an August 8 Prescott meeting of the County Planning & Zoning Commission. Copies of both are posted online. I began with an ancient quote, I’ll end with a modern one: “Think globally, but act locally.”***********************************************************************************************************************
August 4, 2024
Science Works… for Prescott AZ Daily Courier August 4, 2024
Rebooting
Prescott Climate Dialogues
By Stephen P. Cook
After reading my July 7 column “Prescott Planning for Climate Uncertainty” some wanted to give me the boot as a Courier columnist. Rather than being dismayed by their “rants,” having expected “to get my fair share of abuse” (to borrow a Rolling Stones’ lyric) I want to use them to reboot the “Climate Dialogues” we started in 2018. “We” refers to me and Patrick Grady, chair of a local Interfaith group valuing the teachings of “all major religions that call for us to care for one another and for the earth.” We’d hoped to get people across the political spectrum together to discuss global warming, but after sessions involving fifteen people, we realized we were “preaching to the choir.” I never got to engage with climate skeptics.
Before rectifying that, consider the science behind Courier editor Tim Wiederaenders’ July 11 assertion: that “proving it” – meaning linking global climate change to “increasing concentrations of greenhouse gases in the atmosphere”—is “practically impossible.” He’s right.
Mathematicians prove things, scientists don’t. Data gathered by “counting” can be exact —but scientists work with measurements, and all measurements have some uncertainty. Starting 150 years ago with statistical mechanics, then quantum mechanics, and chaos theory, science has moved toward presenting conclusions in terms of likelihood and probabilities.
Climate scientists never completely attribute some outrageously unusual weather—like the continental record 4.5 feet of rain that the Houston area got during the two day 2017 Hurricane Harvey event—to the effects of human-caused climate change. Instead they may say that the latter made the extreme event many times more likely. To illustrate, consider how one reader responded to my saying Phoenix’s July 2023 monthly average temperature of 102.7 exceeding the previous record by 3.6 degrees put us in “uncharted territory.” This was dismissed as “typical climate hysteria using one irrelevant data point.”
That data point departs from the 96.4 degree average of 23 highest monthly average 2000-2022 temperatures by 6.3 degrees. In this large departure I saw a red flag. To counter arguments this was simply random variation, I calculated its statistical significance. From my spreadsheet came answers: a 5.15 standard deviation departure from past, expected behavior with the same climate forces operating, and, given a corresponding only one in three million chance this is random variation, a strong suggestion something different (more climate change caused by people?) is responsible. After doing math, I expressed concern in my column. There, I did not hysterically scream “OVER FIVE STANDARD DEVIATIONS!”— I simply said “uncharted territory.” (Had I done so, I might have been labeled a “standard deviant.”)
Might more pavement and concrete in Phoenix be partly responsible? Yes. We should encourage measures— like planting trees, installing light-colored roofs, etc. —to counter this local heat retention aspect of manmade climate change. But to counter global trends we must reign in heat trapping associated with increasing greenhouse gas. These are behind rising rural temperatures and increasing temperature and acidity of ocean water. And —since warmer air holds more water vapor and warmer oceans lead to more evaporation—can explain extreme rainfall events. And—since uneven warming of polar regions versus tropics cause polar vortex type air mass movement—can explain extreme winter cold snaps. Like 15 degrees below zero in Alamogordo, New Mexico killing thousand year old trees in 2011.
Speaking of cold…One reader wrote, “I’m old enough to remember the global cooling scares of the ‘70s.” This can be traced to a single article in Newsweek, as “The Myth of the 1970s Global Cooling Scientific Consensus” posted online at the American Meteorological Society website explains. That reader, and others, expressed skepticism that solar is the solution and switching to it will bring immediate results. They’re right. It will take decades to make progress in fighting global climate change. We need to use energy more efficiently and wean ourselves off fossil fuel. Photovoltaic solar has emerged as the most practical, cost-effective way to do this and meet our needs—including, as cost of batteries continues to fall and with help (where appropriate) from wind power and pumped hydro storage—delivering base load electricity.
One reader said my column about “globull warming” is “exactly what a professor would write.”
That got me thinking about cattle—resulting in two
tidbits to share. First, reportedly associated with the beef an average American
eats is 1984 pounds / year of greenhouse gas emission (less for grass-fed beef.)
That drops 96 % if plant-based protein replaces beef. Second, cattle
graze on over 800,000 acres of Yavapai County land— compare that with the 8,000
acre limit the County amendment my column discussed seeks to impose on solar. Solar panels and grazing livestock—sheep, not cows—can
share land. And no, solar panels don’t kill wildlife as one reader suggested.
The “professor” putdown seemed a call to debate the value of educational
achievement. Accepting that challenge, I ask, “Can you say, like Donald Trump,
I love the uneducated?” Or do you
value, like I do, “Education for Democracy”?
I’ve attended “The School of Hard Knocks” and with Jefferson,
appreciate “the common man,” but also like what “old school Reagan conservative,” and “smart
person” fan Mike Murphy recently said: “I
don’t like this populist stuff. I don’t want to go find the ten most
irritating idiots on the street and put them in charge. I like people who can do
math, read books… ” —and newspapers, I’ll add.
More Reader Climate Change Concerns and Responses
email
from
JT October 15 2024
I don’t read the Courier unless prodded to do so, so I’m generally
unaware of situations like this. I just read Kading’s column. It’s a bit
snarky, for sure, like it’s meant to agitate you. It seems that has been
it’s effect. Looking at his assertions, I wonder what about them really upsets
you? He makes some accurate points. For example, consider these recent
publications that support his statements:
A 485-million-year history of Earth’s surface temperature. Published
in Science on 9/20/2024, led by Smithsonian and University of Arizona. Showing
clearly that Earth’s climate is hugely variable, and we are in the coldest
period detected in the various records. Useful big picture context.
A recent surge in global warming is not detectable yet. Published in
Nature Communications Earth & Environment on 10/14/2024, led by University
of California and Clemson. Reporting that “results show limited evidence for a
warming surge; in most surface temperature time series, no change in the warming
rate beyond the 1970s is detected despite the breaking record temperatures
observed in 2023” and “that an
acceleration is not detectable at the global level.”
Roles of Earth’s Albedo Variations and Top-of-the-Atmosphere Energy
Imbalance in Recent Warming: New Insights from Satellite and Surface
Observations. Published 8/20/2024 in the journal Geomatics, led by Colorado
State University and the US Forest Service. Their analysis “revealed that the
observed decrease of planetary albedo along with reported variations of the
Total Solar Irradiance (TSI) explain 100% of the global warming trend and 83% of
the Global Surface Air Temperature interannual variability as documented by six
satellite- and ground-based monitoring systems over the past 24 years.”
The Detection and Attribution of Northern Hemisphere Land Surface
Warming (1850–2018) in Terms of Human and Natural Factors: Challenges of
Inadequate Data. Published in the journal Climate in August 2023. Led by
Harvard-Smithsonian Center for Astrophysics, Center for Environmental Research
and Earth Sciences, and scientists from institutions around the world. They
found that urbanization and the urban heat island effect has had a much more
profound influence on surface temperature than is accounted for in current,
dominant models, and that “the scientific community is not yet in a position
to confidently establish whether the warming since 1850 is mostly human-caused,
mostly natural, or some combination.”
Observational Assessment of Changes in Earth’s Energy Imbalance Since
2000. Published in the journal Surveys in Geophysics on May 7, 2024. Led by NASA
Langley Research Center and the NOAA/Pacific Marine Environmental Laboratory.
Presenting data that suggests the Earth is not warming by trapping heat, but
rather by absorbing sunshine as a response to diminishing cloud cover, which has
led to “accelerated increases in global mean temperature, sea level rise,
ocean heating, and snow and sea ice melt.” (Note: There is a flood of papers
coming out on this subject thanks to advances in satellite technology)
I could go on. There are hundreds if not thousands of peer-reviewed
papers in legitimate journals that challenge climate change orthodoxy (the
anthropogenic greenhouse gas hypothesis). I’m not here to defend Kading, nor
the Courier. I’m here, as one of your colleagues in environmental work, to
suggest that the climate change situation is not “settled.” Nor will it ever
be. Science that get’s “settled” is science corrupted.
You’ll probably react to this email by considering me a “climate
denier.” I hope not, but if that’s your conclusion, I’m fine with that –
though it would be surprising given the high-impact sample of papers I collected
here in just a few minutes. I do in fact deny the narrative that is being
promoted by the loudest and most mainstream voices. I strongly reject the claim
that there is scientific “certainty” or “consensus” around anthropogenic
climate change. It defies unbiased scientific inquiry, and it intentionally
ignores reams of evidence that solar, geomagnetic, and cosmic factors have
powerful influence over short- and long-term climate cycles. The dominant
narrative seeks to censor, defame, and deplatform those who don’t abide by
orthodoxy – and that is hardly real science. And it’s losing the trust of
the majority of people, myself included – and MANY young and middle aged,
educated, and “green” voters who I associate with.
So, do what you will with my missive. I am not here to get into a
debate, as I’m too busy. I’m saying this in my hope that you will take an
unbiased approach to educating yourselves and the public – instead of
scrutinizing Kading (or me, for that matter), try and critique the papers I
present here. And most importantly, I suggest you focus on areas of common
ground – that we all want accessible public spaces, clean air, clean water,
and healthy soils/food. That is the messaging that will bring us together, and
solve the most important environmental challenges.
response
from S. Cook, October 15:
I'm glad I copied you on this email thread! Thanks for your comments--I agree with many of them. I am
simply too busy right now to respond at length—but I will study the papers you
cite (some of which I'm familiar with) and perhaps formalize a more detailed
response. Here is what I have time
to say now:
Anyone who understands the changing Earth orbital / astronomical
connection (known as the Milankovitch cycles) to the solar input part of
modeling the Earth's energy balance knows that this is the key driver of
variation of average earth temperatures on the multi 100,000 years time scale.
What is significant in studies of earth temperatures over very
long time periods—after accounting for this solar input variation—is
that generally they track with atmospheric carbon dioxide concentration.
(Higher temps go with higher CO2 levels) This (CO2 concentration) is a
key variable on the energy escaping back out into space of
modeling the Earth's energy balance.
(Note: if equilibrium over long run ,
energy in = energy out, no temperature change)
No one disputes rising carbon dioxide concentration (from around 280 ppm
to 425 ppm) in last 200 + years--and it is but a simple jump from that to the
expectation of rising temperatures. Obviously
this is much too simple-minded, given all of the places energy can go, both
coming in and getting out...
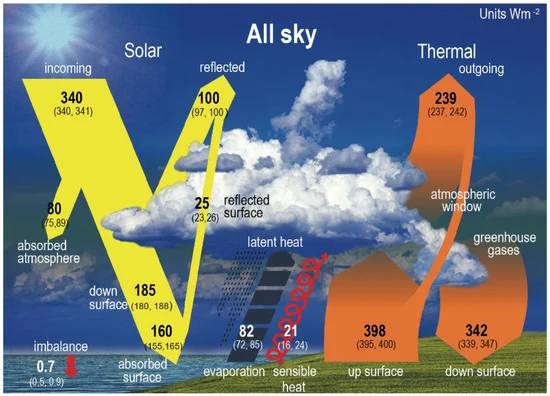
Figure
15. The global mean energy budget of Earth according to IPCC AR6 [2] (Section
7.2.1), their Figure 7.2. Numbers indicate the best estimates for magnitudes of
the globally averaged energy balance components in W m−2, together with
their uncertainty ranges in parentheses (5–95% confidence range), representing
all-sky climate conditions at the beginning of the 21st century. According to
this diagram, the Tropospheric Energy-Flux Attenuation Coefficient (TEFAC) is
239/(398 + 82 + 21) = 0.477.
I first started running computer programs based on modeling earth-sun
energy balance equations in the early 1990s and have steadily seen them grow in
complexity as computer power and understanding of atmospheric / ocean / ground
physics heat transfer processes etc involved has increased.
Early on I realized that the role of changing albedo feedback loops that
go into these models (most notably as polar ice melts, dark ocean water has
lower albedo leading to more solar energy absorbed, warm temps, more melting,etc.).
And realized that the extent to
which feedback loops kick in is big source of uncertainty (along with how clouds
work, evaporation of water cycle details given that more water vapor in
atmosphere acts like greenhouse gas / water vapor feedback loop, absorption of
energy by oceans, etc.)
Anyway, I will look at the changes in albedo paper you cite, but my
point is that IPCC / climate scientists follow all of these details very
closely. If new research suggests tweaking climate models, I am confident it
will be done so as to best model a very complicated situation.
The first paper you cite has a University of Arizona connection. A key
researcher there—and IPCC member—is Geosciences professor Jessica Tierney.
Something she emphasizes in long-term years earth temperature studies is that the rate of temperature change
seen in the last 150 years is totally unprecedented. Here is a graph from her work: "Global
Temperatures Over Last 24,000 Years Show Today's Warming 'Unprecedented
It includes a graph of global temperature change over the last 24,000
years showing dramatic rapid uptick in last 50 years or so.
This rapid warming is something that ecosystems will struggle to respond
to. (It is part of the "uncharted territory" I write about.) Example:
forces of biological evolution operate much more slowly in forest ecosystems
(more like thousands of years needed between climax forests ) and all this is
expected to drive increasing rate of species extinctions. I will read the albedo
/ USFS paper you cited with interest because I know cutting trees /
reforestation (i.e planting one trillion trees worldwide to counter rising
greenhouse gas emissions) involves
significant albedo changes.
Note: following the above
assumes more than a 5th grade level of science education...
Gotta go — discussion to be continued.
Steve
response
from S. Cook, more from
October 28
Finally had a chance to look over this (previously cited by you) paper:
Roles of Earth’s Albedo Variations and Top-of-the-Atmosphere Energy
Imbalance in Recent Warming: New Insights from Satellite and Surface
Observations. Published 8/20/2024 in the journal Geomatics, led by Colorado
State University and the US Forest Service.
At his glance it appears to be a legitimate effort by people who
understand some climate physics and how to interpret data...but wow: after
closer inspection I'm convinced this is more pseudoscience than science!
Basically it ignores the key importance of long wavelength heat trapping
by green house gases (GHG) --something
that has withstood roughly 150 years of scrutiny --in favor of a bizarre loss of
kinetic energy mechanism facilitated by decreasing air pressure with altitude.
(see my previous email citing one reason to be skeptical: that historical earth
temps generally vary with GHG concentation once other variables are controlled )
And it engages in some circular reasoning --which I put in in bold below, etc.
Rather than write more I'm pasting in comments found online since they
cover much of what I would write (and then some):
Critique: Roles of Earth’s Albedo Variations and Top-of-the-Atmosphere
Energy Imbalance in Recent Warming
This new paper by Ned Nikolov and Karl F. Zeller point out the
importance of the recent declining albedo to global warming, but it also
contains major errors. The abstract says
“Here, we quantify the effect of the observed albedo decrease on Earth’s
Global Surface Air Temperature (GSAT) since 2000 using measurements by the
Clouds and the Earth’s Radiant Energy System (CERES) project .…” The
author report that according to CERES observations, the Earth’s all-sky albedo
has declined by 0.79% from March 2000 to 2023 causing an increase of solar
radiation absorption of 2.7 W/m2.
The authors convert that flux to temperature using an equation derived
from a curve fitted to the ratio of the average surface temperature (Tb in the
paper) to the calculated temperature without an atmosphere (Tna) versus
atmospheric pressure of 3 planets and 3 moons. The authors assume that a surface
temperature change is due to only a change in incoming solar radiation and a
change of albedo, which is the ratio of reflected solar to incoming solar. That
is, no greenhouse gas induced warming is considered. This leads to a modeled
surface temperature trend from changes of albedo and incoming solar of 0.24 °C/decade,
while the observed trend in 0.23 °C/decade. The authors conclude that solar and
albedo forcing explains the entire multi-decadal warming trend from 2000 to
2023. Note that they assume the temperature is determined only by absorbed solar
energy, and then calculate that the recent temperature trend is due to only the
trend of absorbed solar energy, which circular reasoning. This means that the
conclusion is invalid.
A planet without greenhouse gases (GHG) would not have an elevated
surface temperature (Tb/Tna > 1). If
GHG on Earth were replace with the same mass of N2, Earth's surface temperature
would be much colder. Pressure by itself can't cause an elevated surface
temperature. Pumping up a flat tire causes the tire to warm up because the
compressor is adding energy, but soon after the tire is inflated, the tire
returns to the temperature of the surrounding air. Likewise, a planet without
GHG would have the same temperature as the planet would have without any
atmosphere. Gravity caused the
pressure gradient. Gravity and GHG together causes the Earth's tropospheric
temperature gradient, or lapse rate, about -6.5 °C/km. Without GHG, there can't
be a temperature gradient, and there can't be a greenhouse effect without a
temperature gradient. Radiative transfer by GHGs through the troposphere drives
convection towards the lapse rate.
The centre of mass of the atmosphere corresponds to a height with a
pressure of half that of the surface pressure. This is also exactly where the
number of CO2 molecules below and above is equal. Therefore you would expect
this to approximately coincide with the effective emission height – but for a
different reason. It is because above this level the IR ‘fog’ clears and
photons can escape freely to space. It is not surprising that a few planets and
moons have elevated temperatures that roughly fit a curve of pressures. See this
article by Clive Best.
The surface measurements are significantly affected by the urban heat
island effect (UHIE). The surface temperature trend should be reduced to account
for the UHIE. The first paragraph of the introduction says that figure 7.3 of
the IPCC WG1 report shows a “positive trend in the Earth’s reflected solar
radiation …” However, the figure's caption says " All flux anomalies
are defined as positive downwards ... ". The authors of the paper
apparently failed to read the caption to the figure and didn't realize that
increasing values means decreasing solar reflection.
*****************************************************************************************************************